This page was published for Genetics 564 at the University of Wisconsin- Madison
What is phylogeny?
The comparison of two proteomes from two separate species can determine how long ago the species diverged from one another in evolutionary history purely based off of the differences in the amino acid sequences. Typically, those species that share a more recent common ancestor exhibit fewer differences than those which have diverged long ago. Gathering data from multiple comparisons can lead to the formation of a phylogenetic tree, which depicts the evolutionary relationships between various species [1]. Here, histone-lysine N-methyltransferase, H3 lysine-36 and H4 lysine-20 specific isoform b from humans was compared to the nine other species to determine that map. Constructing maps like this is extremely helpful in the in-depth study of a particular protein of interest. The image below shows the specifics of a basic phylogenetic tree.
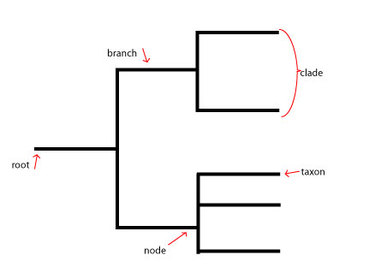
Figure 1: This phylogenetic tree diagram shows the key characteristics of a typical diagram. The root refers to the common ancestor of all the species involved in the diagram. The branch corresponds to the length of time since a particular evolutionary divergence (the longer the branch, the longer ago the separation occurred). Nodes specify more recent common ancestors of more modern species. A taxon is the taxonomic group representing a species. A clade is a group of taxa related by a recent common ancestor at a close node.
In order to construct a phylogenetic tree, all that is needed is the amino acid sequences of the various species to compare to one another. After determining the access numbers and FASTA files for each homolog, the full amino acid sequences can be copied into a Multiple Alignment program like ClustalW2, MUSCLE, or T-Coffee. Multiple Alignment programs do exactly that: align a series of nucleotide sequences to determine significant phylogenetic results.
There are a few variations of the tree possibly obtained from sites like this. The first notable differentiation is between the neighbor joining tree and the average distance tree. Neighbor joining doesn't require all species to have diverged in equal amounts. The focus for constructing these trees is on the location of the nodes rather than the taxa, creating shorter branch lengths and optimizing sets of data with large variation in evolutionary divergence [2] . Average distance trees use the percent identity to calculate distances via alignment comparison [3].
The other notable differentiation is between the use of percent identity (PID) and BLOSUM62. PID, as the name suggests, is the comparison of the percent identity between the species. BLOSUM62, on the other hand, uses a scoring method comparing likely amino acid residues at different locations on the sequences to develop a tree [4].
Here, ClustalW2 was used to produce two different phylogenetic trees shown below.


|
Figure 2: This is the phylogenetic tree formed by average distance using BLOSM62.
|
Figure 3: This is the phylogenetic tree formed by neighbor joining using BLOSUM62.
|
Analysis
The two phylogenetic trees proved to not be visibly different other than general branch length, however owing to the definition of a neighbor joining tree versus an average distance tree, these trees are exactly the same. Referring back to the protein identities, there is highest congruence between humans and chimpanzees, as we see here. The next highest percent identity corresponds to the large mammals (rhinoceros, manatee and horse), which can be easily seen in the phylogenetic trees here, and so forth throughout the remaining animals. Interestingly, there is a high percent identity between cow NSD1 and human NSD1, but the trees show a more distant common ancestor than with, say, chickens, which only have a 58% identity shared. Overall, it appears that the congruence between the two BLOSUM62 trees signifies a higher degree of significance than the variability in the various trees in gene phylogeny. Focus of future study would be better centralized around protein function for this reason.
| fasta_protien_.txt |
References:
[1] Brown, TA., (2002) Genomes 2nd Edition. Available from http://www.ncbi.nlm.nih.gov/books/NBK21122/
[2] Neighbor Joining Method. De Duve Institute. Retrieved February 15, 2014, from http://www.icp.ucl.ac.be/~opperd/private/neighbor.html
[3] Theobald, D., (2012) Introduction to phylogenetics. 29+ Evidence for Macroevolution Retrieved February 14, 2014, from http://www.talkorigins.org/faqs/comdesc/phylo.html#trees
[4] Jalview. Retrieved February 14, 2014 from http://www.jalview.org/help/html/calculations/tree.html
