This page was published for Genetics 564 at the University of Wisconsin-Madison
What is homology?
Homology is noted as the structural similarity between traits in different species based on divergence from a common ancestor. Similarities of this nature can be utilized in further study of a particular organism or anatomical area of interest. This report focuses on gene homology in particular. Gene homology (Figure 1) refers to genes that show sequence similarities based on this notion of a common ancestor. These sequence similarities do not necessarily mean functional similarities, however relatedness in this manner can help to define the function of an unknown gene at a more in-depth level. Additionally, gene homology can direct researchers to model organisms that could potentially be utilized in future experimental study [1][2].
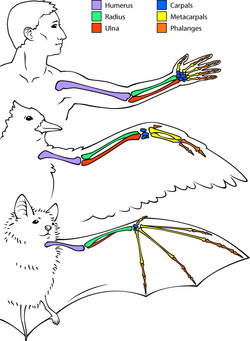
Figure 1: This image shows an illustration of structural homology. The different bones in the various arms of the human, bird and bat have similar structure as noted by the coloring.
Identifying homology in NSD1
To search for homologs (the individual species that share gene sequences) in NSD1, Homologene was used to first compare the mRNA sequence of NSD1 with a number of noteworthy model organisms. The post-transcriptionally modified mRNA was chosen to compare due to the large nature of the pre-modified nucleotide sequence. Comparisons are evaluated on degree of similarity and sorted in order of most similar to least similar [3]. These matches were then tested for validity using the Basic Local Alignment Search Tool (BLAST), an online tool that compares nucleotide sequences to a database of genomes from a plethora of different organisms [4]. A particular species was considered valid if the top hit on a reciprocal BLAST (that is, a search done for the human gene to the species of interest and then back to humans) was the original gene in question. A variety of species were chosen from the results that exhibited a high percent of similarity (approximately >45%) in sequence and a significantly low Expect (E) value. E values close or exactly zero signify a high probability that the sequences chosen out of the database were not purely there by chance and the similarity is actually significant [5].
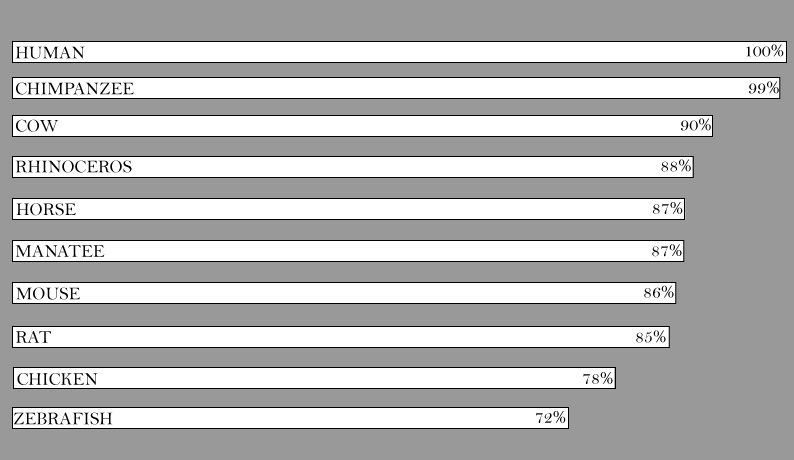
Figure 2: This figure shows the percent identity to the reference human NSD1 gene. Percentages retrieved from BLAST.
Analysis
NSD1's high degree of similarity (Figure 2) between humans and this wide variety of model organisms suggests that there is some evolutionary significance to the function of this gene. The high percentages alongside the consistently low E values (with all organisms at 0.0) shows statistical significance of gene conservation throughout. Curiously, the homology did not correspond directly to NSD1 transcript variant 2. Differences in variants has not shown to be prominent in literature, so there shouldn't be much variation in function between, say, transcript variant 2 in humans and 8 in chimpanzees.
I thought it was interesting that the human gene NSD1 shared the highest percent identity with chimpanzees, followed by other large mammals including the horse, cow, rhinoceros, and manatee, and ultimately the mouse at 86%. The majority of studies conducted on NSD1 have been done using a mouse model, and although it is more cost effective to genetically modify a mouse rather than a horse, it would seem that preferred research models would have the highest percent gene identity possible.
I thought it was interesting that the human gene NSD1 shared the highest percent identity with chimpanzees, followed by other large mammals including the horse, cow, rhinoceros, and manatee, and ultimately the mouse at 86%. The majority of studies conducted on NSD1 have been done using a mouse model, and although it is more cost effective to genetically modify a mouse rather than a horse, it would seem that preferred research models would have the highest percent gene identity possible.
Homologous gene reference numbers
|
Human (Homo sapiens): Nuclear receptor SET domain protein 1 (NSD1) transcript variant 2
Accession Number: NM_022455.4 GI Number: 182507166 FASTA Mouse (Mus musculus): Nsd1
Accession Number: NM_008739.3 GI Number: 118918399 FASTA E Value: 0.0 Percent Identical: 86% Chimpanzee (Pan troglodytes): NSD1 transcript variant 8
Accession Number: XM_527132.3 GI Number: 410040051 FASTA E Value: 0.0 Percent Identical: 99% Zebrafish (Danio rerio): Nsd1b
Accession Number: XM_001923052.4 GI Number: 528514300 FASTA E Value: 0.0 Percent Identical: 72% Florida Manatee (Trichechus manatus latirostris): NSD1 transcript variant 1
Accession Number: XM_004371154.1 GI Number: 471361290 FASTA E Value: 0.0 Percent Identical: 76% |
Rat (Rattus norvegicus): Nsd1
Accession Number: NM_001107337.1 GI Number: 157822346 FASTA E Value: 0.0 Percent Identical: 85% Chicken (Gallus gallus): NSD1 transcript variant X4
Accession Number: XM_414538.4 GI Number: 513206703 FASTA E Value: 0.0 Percent Identical: 78% Cow (Bos taurus): NSD1 transcript variant X2
Accession Number: XM_005209162.1 GI Number: 528956164 FASTA E Value: 0.0 Percent Identical: 90% Horse (Equus caballus): NSD1 transcript variant X1
Accession Number: XM_001502429.4 GI Number: 545184252 FASTA E Value: 0.0 Percent Identical: 87% Southern White Rhinoceros (Ceratotherium simum simum): NSD1 transcript variant 1
Accession Number: XM_004428474.1 GI Number: 478508496 FASTA E Value: 0.0 Percent Identical: 88% |
References:
[1] Eisen, J. (1998) Phylogenomics: improving functional predictions for uncharacterized genes by evolutionary analysis. Genome Res, 8, 163-167. doi: 10.1101/gr.8.3.163
[2] Evolution for Teaching. (2004). The University of Waikato. Retrieved February 3, 2014, from http://sci.waikato.ac.nz/evolution/Homology.shtml
[3] Homologene Build Procedure. National Center for Biotechnology Information. Retrieved February 5, 2014, from http://www.ncbi.nlm.nih.gov/homologene/build-procedure/
[4] Madden, T., (2011). BLAST Help manual overview. In BLAST Help Manual. Retrieved from http://www.ncbi.nlm.nih.gov/books/NBK52636/
[5] BLAST FAQs. National Center for Biotechnology Information. Retrieved February 5, 2014, from http://www.ncbi.nlm.nih.gov/blast/Blast.cgi?CMD=Web&PAGE_TYPE=BlastDocs&DOC_TYPE=FAQ#expect
