This page was published for Genetics 564 at the University of Wisconsin- Madison
What is phylogeny?
The comparison of two genomes from two separate species can determine how long ago the species diverged from one another in evolutionary history purely based off of the differences in the nucleotide sequences. Typically, those species that share a more recent common ancestor exhibit fewer differences than those which have diverged long ago. Gathering data from multiple comparisons can lead to the formation of a phylogenetic tree, which depicts the evolutionary relationships between various species [1]. Here, NSD1 from humans was compared to the nine other species to determine that map. Constructing maps like this is extremely helpful in the in-depth study of a particular gene of interest (in this case, NSD1). The image below shows the specifics of a basic phylogenetic tree.
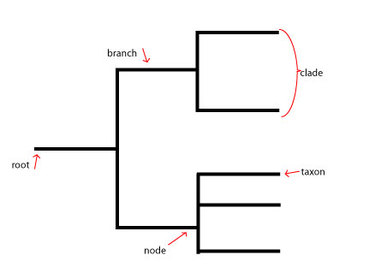
Figure 1: This phylogenetic tree diagram shows the key characteristics of a typical diagram. The root refers to the common ancestor of all the species involved in the diagram. The branch corresponds to the length of time since a particular evolutionary divergence (the longer the branch, the longer ago the separation occurred). Nodes specify more recent common ancestors of more modern species. A taxon is the taxonomic group representing a species. A clade is a group of taxa related by a recent common ancestor at a close node.
Determining phylogenetic trees
In order to construct a phylogenetic tree, all that is needed is the nucleotide sequences of the various species to compare to one another. After determining the access numbers and FASTA files for each homolog, the full nucleotide sequences can be copied into a Multiple Alignment program like ClustalW2, MUSCLE, or T-Coffee. Multiple Alignment programs do exactly that: align a series of nucleotide sequences to determine significant phylogenetic results.
There are a few variations of the tree possibly obtained from sites like this. The first notable differentiation is between the neighbor joining tree and the average distance tree. Neighbor joining doesn't require all species to have diverged in equal amounts. The focus for constructing these trees is on the location of the nodes rather than the taxa, creating shorter branch lengths and optimizing sets of data with large variation in evolutionary divergence [2] . Average distance trees use the percent identity to calculate distances via alignment comparison [3].
The other notable differentiation is between the use of percent identity (PID) and BLOSUM62. PID, as the name suggests, is the comparison of the percent identity between the species. BLOSUM62, on the other hand, uses a scoring method comparing likely amino acid residues at different locations on the sequences to develop a tree [4].
Here, ClustalW2 was used to produce the four different phylogenetic trees shown below.


|
Figure 2: This phylogenetic tree exhibits the neighbor joining tree using PID from the ClustalW2 Multiple Alignment program.
|
Figure 3: This phylogenetic tree exhibits the average distance tree using PID from the ClustalW2 Multiple Alignment program.
|


|
Figure 4: This phylogenetic tree exhibits the neighbor joining tree using BLOSUM62 from the ClustalW2 Multiple Alignment program.
|
Figure 5: This phylogenetic tree exhibits the average distance tree using BLOSUM62 from the ClustalW2 Multiple Alignment program.
|
Analysis
There was a pretty heavy difference in all of the trees produced from the ClustalW2 program. In all four trees, it is apparent that humans and chimpanzees are most commonly related to one another, which coincides with the homology results and was expected. According to the homology, the next closest relative to humans should be the other large mammals (cow, horse, rhino, manatee). In the PID trees, the four large mammals are generally grouped together, coinciding with the homology results. However, in the BLOSUM62 trees, there tends to be some odd relatedness between the cow and the zebrafish (Figure 4) and the cow out on its own (Figure 5). Generally, though, the PID trees tend to be a bit more true to the homology results. Specifically, the average distance tree seems to be more in line with the percentages seen from the homology.
| fasta_gene_phylogeny.txt |
References:
[1] Brown, TA., (2002) Genomes 2nd Edition. Available from http://www.ncbi.nlm.nih.gov/books/NBK21122/
[2] Neighbor Joining Method. De Duve Institute. Retrieved February 15, 2014, from http://www.icp.ucl.ac.be/~opperd/private/neighbor.html
[3] Theobald, D., (2012) Introduction to phylogenetics. 29+ Evidence for Macroevolution Retrieved February 14, 2014, from http://www.talkorigins.org/faqs/comdesc/phylo.html#trees
[4] Jalview. Retrieved February 14, 2014 from http://www.jalview.org/help/html/calculations/tree.html
